Zoltan explains: Oscilloscope crash course

This is some ramble about how to get the most out of your oscilloscope without going too much into details. I will talk about analogue oscilloscopes mostly, as digital scopes are more straightforward but sometimes can be very problematic, just like driving an automatic car on icy road. I had a few of analogue oscilloscopes, like the OML-2M from the Soviet Union, and the RFT EO-213 from GDR, which I still have. Extremely reliable kits.

First of all, let’s be clear on what is an oscilloscope and what it does:
The oscilloscope (or just simply ‘scope) is a device that can show the voltage of an electrical signal/signals with respect to time. The scope has a cathode ray tube with a horizontal trace, which is called the timebase. The scanning speed of the trace is controlled by the ‘Time per division’ knob, which may be annotated as ‘ms/T’ or ‘Time/div’ or simply ‘Horizontal’. Voltage is measured by the vertical deflection with respect to the divisions of the screen. It is adjusted by the ‘V/T’ or ‘Volts/div’ or ‘Vertical’.

In order to make anything visible on the screen, the timing of the start of the timebase has to be perfectly aligned with the signal. This alignment is controlled via the triggering circuit: Yes, the timebase is started at each time how the ref pulls the trigger of a pistol on each start of a sprint race, hence the name.
How the triggering should be done? On old scopes, it can be done with either on rising or falling edge detection. There should be a switch for that. The exact voltage value where the triggering starts is set with the ‘Trigger’ knob. When the trigger level is outside the trace, the screen will run and not much is to be seen. Just adjust the trigger knob, and it should stabilise.

So, step-by-step:

Before connecting to the signal

-Adjust the ‘Time/div’ knob to the right value (say 1 kHz signal -> 0.5 ms/div)
-Adjust the ‘Volts/div’ knob to an approximate value (say 200 mV peak voltage -> 50 mV/div)

After connecting to the signal

-Set the ‘Trigger’ switch to rising edge
-Adjust the ‘Trigger’ knob until trace stabilises

Of course, on digital scopes you can just press ‘Auto Setup’ (or what I call the ‘Oh my god I am terribly lazy’) button, and the scope will adjust these things for you. Or not.

If it fails to set, setting it up boils down to the good old analogue method.
For the sake of simplicity, I have attached a few pictures where I annotated each sections with my graphics tablet. You can read the settings on the screen of a digital scope.

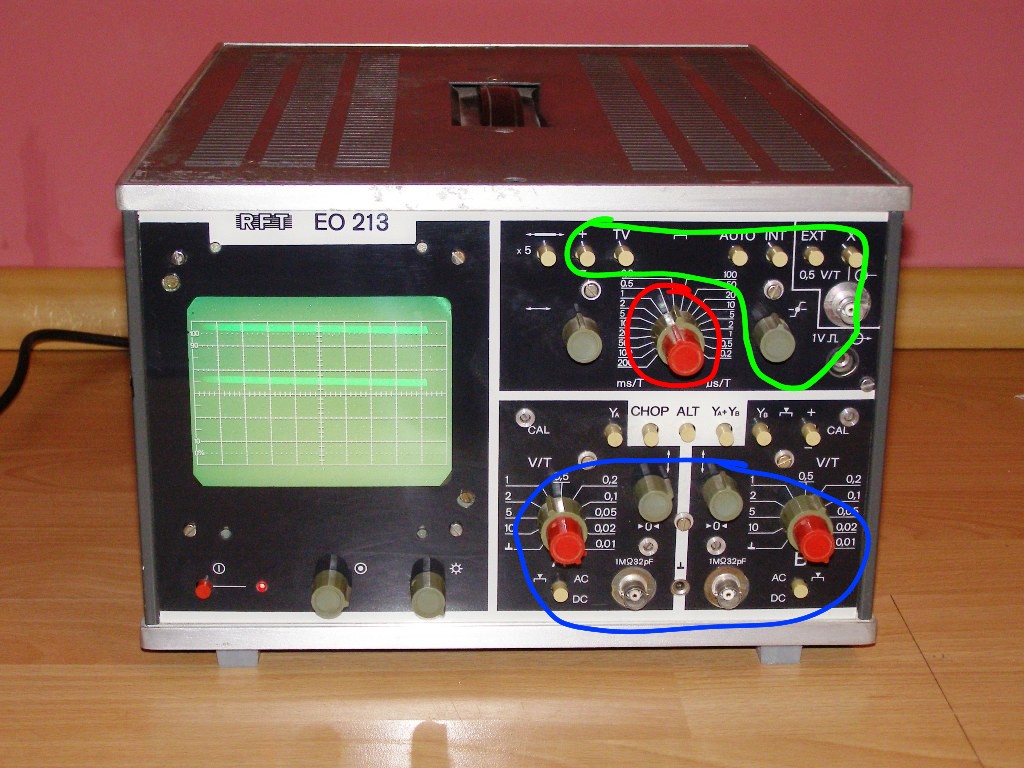
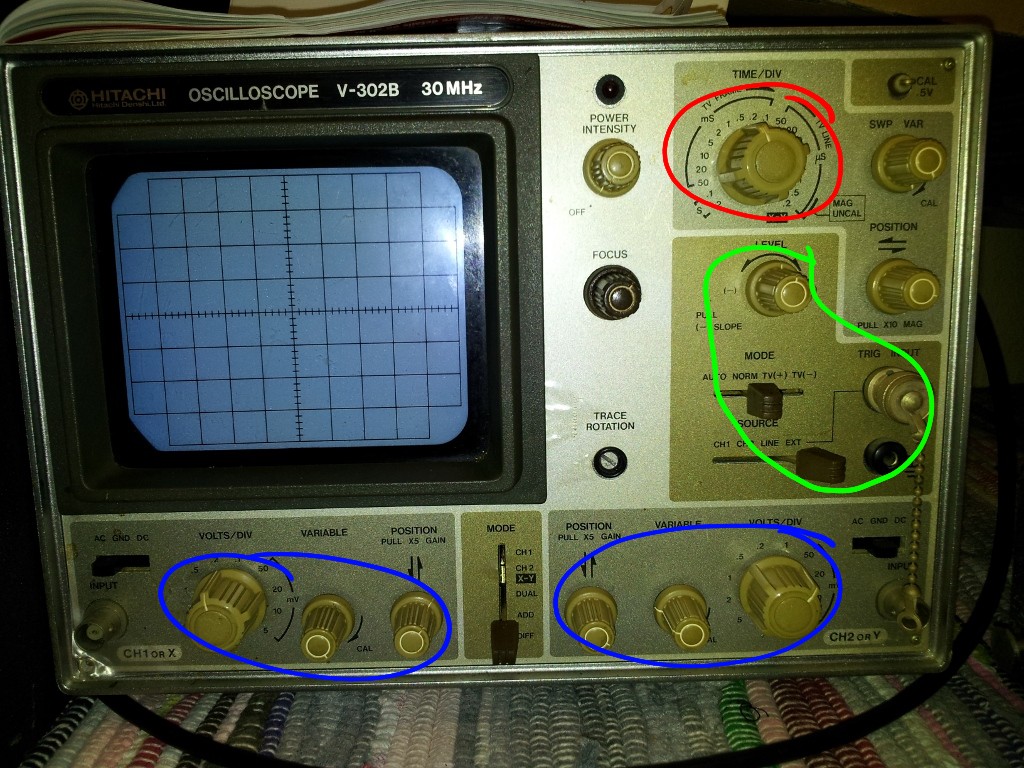
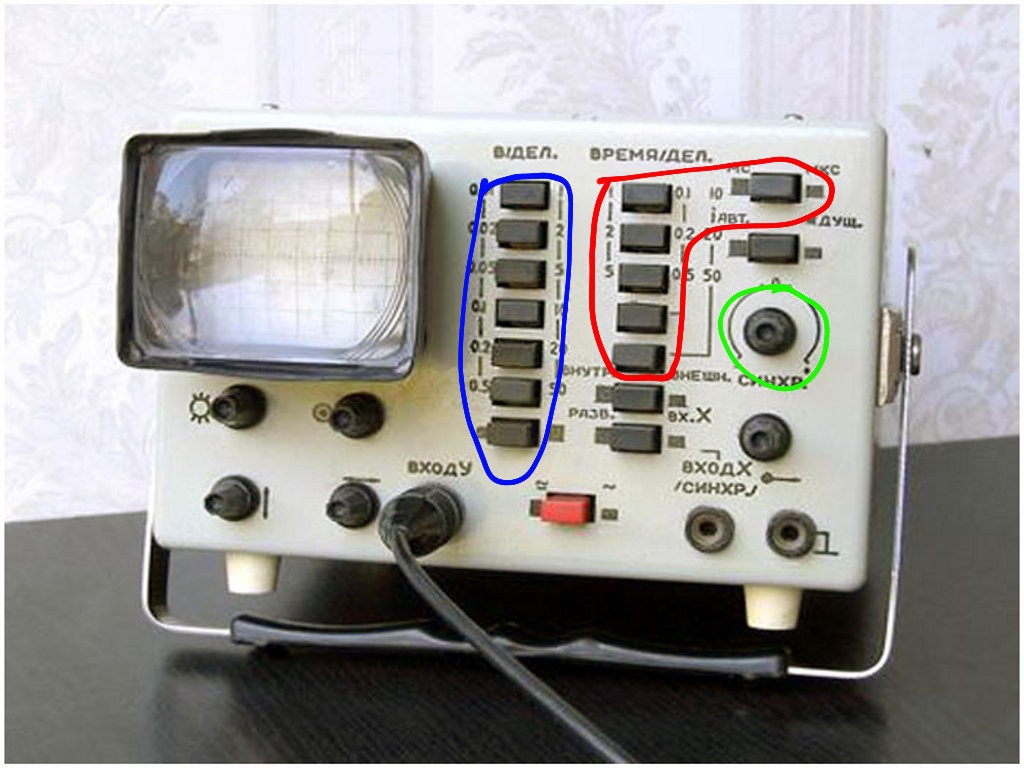
-Red: Time per division
-Blue: Volts per division
-Green: Trigger


The OML-2M was a low-end, single channel scope, with a modest amount of controls for triggering.
(Source)
The RFT EO 213 supports TV vertical sync pulse detection as well as analogue calculation of the two channels. Edge selection is done with the +/- button in the green area.

(Source)

Going West (well, East actually), the same category of analogue oscilloscope is not that different. A little bit more options, fancier design: you can select between TV lines, change the triggering source channel. You have to pull the trigger knob  to change to falling edge. This Hitachi V-302B oscilloscope was donated to the ANARC radioclub:

(This is a picture I made, but you can use it freely…)

And when you are getting into up-to-date equipment, you will get into the wonderful world of digital scopes. The high-end ones run Windows, so triggering is just a problem of selecting from the menu. However, this HAMEG HM507 scope is interesting. It tries to merge the best of both worlds, allowing ‘analogue-like’ behaviour with the advantage of storing samples and time-related operations (such as averaging, persistence, etc.). Anyway, from this point the challenge moves from finding what knob is where on a current model to reading and understanding the contents of the screen. Which one is more difficult? Well, it depends 🙂
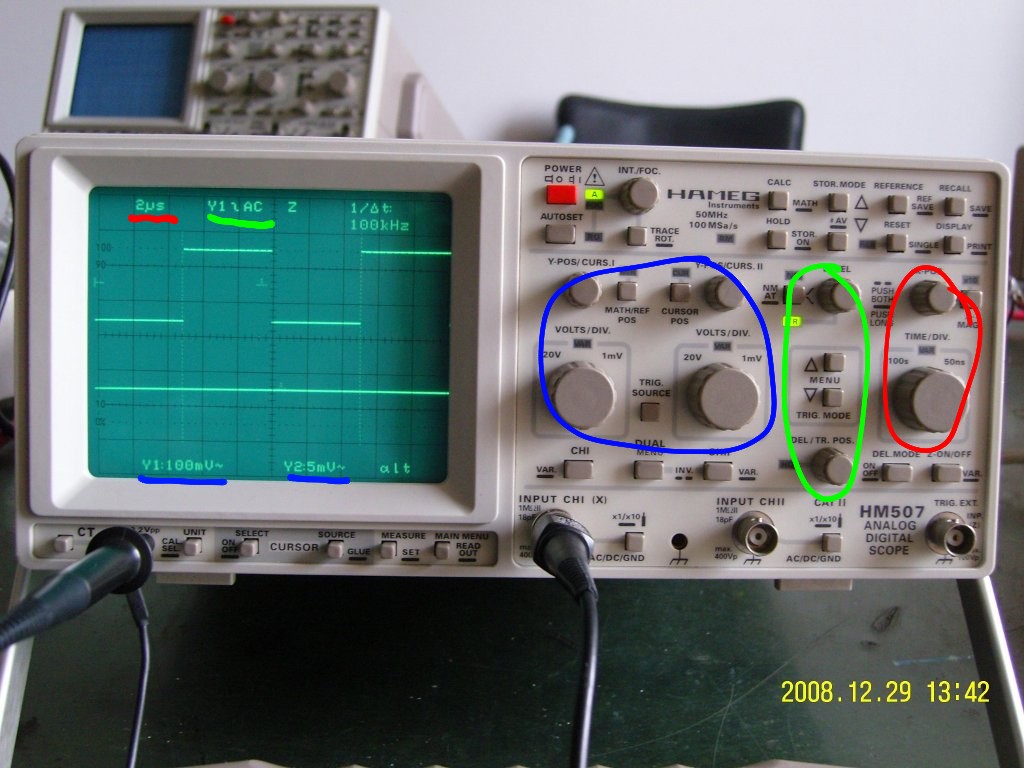
(Source)

If you’d like to have your scope added, let me know!

Zoltan’s diary: Friday 01/03/2013

Having worked yesterday for so long, it’s quite frustrating to realise you are very close but you can’t finish because of time. Quality is more important than quantity though.

I got my processing script finished. I only checked it twice, but it seems that it works: Loads all data, processes all data, and displays a bunch of nicely refined graphs telling me what the crack is.

The design is adaptive, so I can vary the number of data points, the amount of files to be loaded, and I have access to interim stages in processing. So, if I made a mistake somewhere, I will have at least a hunch on where things might went wrong. Modularity above all. I think I will use this script pretty often in the future, so I better document it in many places. Okay, I know I usually over-comment code anyway, but finding out what my code does years later is more annoying.

I had so many volunteers for my experiment that I ran out of chocolate. Need to obtain more chocolate.

Zoltan’s diary: Thursday 28/02/2013

I got more data. Loads more. thankfully, they all seem to make sense, and I can see the difference from person to person and can tell how precise/careless the person was.

Now, it comes to processing. I got some emails from Jenny regarding processing and stats. Most of the stuff in it is interesting, and was largely corresponding to my ideas of processing. I spent most of tonight in the lab, and was busy processing data.

I am making an almost-fully-automatic data loader, sorter and visualiser. It now loads all files from a directory, does the mandatories (Mean, SD, etc.) and does some plots. I am working from low-level data files, as I find them the most reliable and independent. Just need to do a little bit more number crunching. I am using my parameter array as a look-up table, so it seems that everything is flexible. Good times.

Zoltan’s diary: Wednesday 27/02/2013

Some more results were acquired today. It turned out that the full test can be done in only 45 minutes, comfortably. Since the problems in the experimental design have been eliminated, I think I now get the unbiased, unskewed , ‘unweird’ results. This is good, because it will give me some space from those imaginary (very real) hostile reviewers. And I have fixed datapoints, parametric zones, nicely organised into a giant table. Can tell which of the 16 types of tests were done to get particular results just by looking at the raw data.

I am saving everything twice per task, so I will still have some usable data if there is a blackout or matlab decides to crash. I have my own file format, I have my own escape characters and result processing method.

Tomorrow, I will persuade more people to do tests and make a script to generate some nice graphs… unless if something happens.

Zoltan’s diary: Tuesday 26/02/2013

The primate add-on practical was very interesting. Learned a lot about monkeys. I spent most of today rewriting my matlab code so it will comply to the new specification. It works. The measurement artefact I have been having is gone. I now have other problems, but I can handle them. 36 Hz on full brightness is not nice, and I don’t think it can be ignored as not flickering.

I did a set of measurements on myself, collecting 160 datapoints was about 45 minutes. I would say, it will be about 60-80 minutes for someone who is not confident handling the rig. Not bad.

However, I had a blunder saving data and had to do it again.

Cultural differences

funny

Lost in Translation

I came across this recently from The English Teachers Collective, and it struck me as very apt and funny. I think I often use “I would suggest…” and “Very interesting” with the meanings indicated. It would be amusing to add some other cultures, e.g.
What the Germans say: “I do not think your idea will work.”
What the Germans mean: “I do not think your idea will work.”
What the British understand: “She does not think my idea will work and has contempt for me as a person.”

I am trying to learn some Japanese language and culture at the moment, and am definitely seeing similarities to British. Both cultures seem to prefer it if facts are referred to obliquely so as to allow the other person to infer them; direct statements are considered rude and abrasive. Maybe it’s an island thing.

Any comments from the non-British people in my lab? Can you figure out what I am saying?

Zoltan’s diary: Monday 25/02/2013

The first part of today went with the remainder of Modules 1-3. Aurélie Thomas was really patient with me, and I passed the assessment afterwards. Primate practicals tomorrow.

Then, I had the meeting with Jenny. Unfortunately she verified that there was a potential flaw in my experimental design. Not a big one, but I don’t want to have my work ruined by a ‘hostile reviewer’ in the future, so I better cover it up now.
Did some more paperwork, and logged everything I could find in the book in chronological order. Tomorrow will be a long day, as I will clean up my function and will implement the changes.

Also, the test parameters can’t be just random. I need to have it using certain logarithm-based, increasingly-stepped levels that focus on problematic areas. This will enable me to have the same number of experiments with every parameter type (array), and will be able to randomise from that, using pointers. This way, I manage to get the best of both worlds. Kinda.

Zoltan’s diary: Friday 22/02/2013

The moral of this day was to realise that how hard it is to obtain reliable data. The worst thing you could do is to have a minimal amount of data, and make conclusions going too far from them.

Valuable lesson. I will harass more people to have enough pilot data. I think I will have to re-design the test, as there are some interesting regions that need more attention.

Zoltan’s diary: Thursday 21/02/2013

Spent some (most of today’s) time with Matlab. Basically, number crunching, plotting, added some functionality to the tests, and tested myself properly. Found an anomaly in the parameter randomisation method, which will give me a headache later on. They are randomised, but I need to make sure that I have precise control of the ratio of the parameters used. Because right now, as far as the parameter generation algorithm is concerned, I could have 200 tests of the same type and none of the one that I would be interested in.

Why do I need to test for something I don’t really need? I need a reference. My front paw (a.k.a hand) is not a precise instrument. I may slip the mouse, not manipulate keys properly, make typos basically all the time. It’s really like military technology: we don’t care how good/bad it is as long as we precisely know how good/bad it is. (for those who don’t speak English as a main language – like myself there is a difference in the qualitative and quantitative use of the word ‘how’)

The results were a lot less vague than yesterday. Also, a lot more consistent, which is a plus. In addition to that, I need to do very little manual work on the results, so the process is largely automated.

However, my visual pathway still doesn’t know how to do integration, and is being consistently fooled at the same luminance levels. I wonder if that is the case with others.

Well, time to call in a few favours, let them stare at the glass through two periscopes for some time (as well)!