


The Warping Effect
In our mantis contrast sensitivity paper (http://tinyurl.com/mantiscsf) we used the following formula to calculate the spatial frequency of grating stimuli in cycles per degree (cpd):
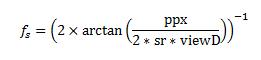
Where ppx is the grating period in pixels, sr is the screen resolution in px/cm and viewD is the viewing distance in cm.
This equation assumes a linear correspondence between screen pixels and the visual angle subtended by these pixels (in degrees). The conversion ratio is effectively the average over one grating period; for example a spatial period of 100px corresponds to 20.25 degs making the effective conversion ratio 4.94 px/deg.
When viewD is sufficiently large (which is typical for human experiments) the assumption of a linear correspondence between screen pixels and angle subtended holds (i.e. differences are negligible). However, for small viewD there could be considerable differences as gratings subtend smaller angles the further they are from the centre and thus the stimulus appears to be “squeezed” near the screen ends.
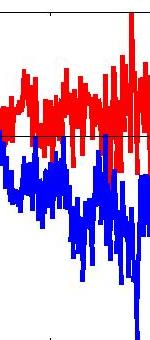
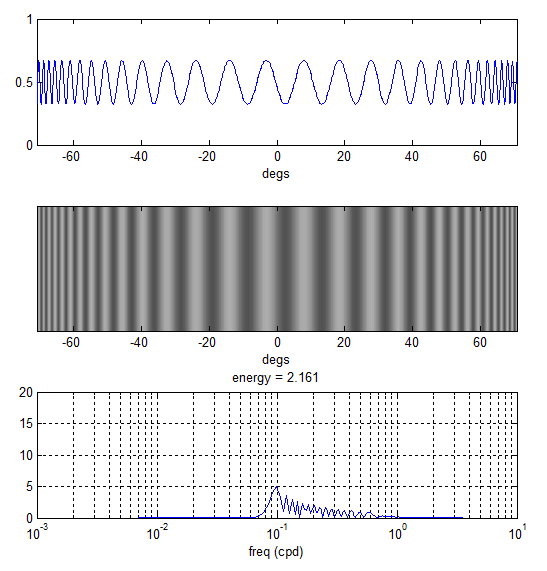
The plots below demonstrate this effect. The top two plots show a horizontal sinusoidal grating of period 5 px (sr = 40 px/cm) as perceived by an observer 7cm away from the monitor. Instead of a constant frequency in cpd there is actually a range of frequencies going from low (at the screen centre) to high (at both ends). The bottom plot is a frequency spectrum showing how broadband this actually is. Using the equation above fs = 0.978 cpd for this stimulus while the actual spectrum goes from 0.08 all the way up 0.6 cpd.
How to correct for this
One way to correct for this is to incrementally increase the grating period as we move away from the screen centre. For an observer standing sufficiently away from the monitor such a stimulus would appear squeezed at the centre and stretched at the sides. At the right viewing distance, however, all gratings will subtend the same visual angle.
This can be done in multiple ways in Matlab. I’ve found the following particularly intuitive and easy to implement:
- Calculate the visual degree corresponding to each px on the screen given a viewing distance and a screen resolution (the function px2deg does this for you)
- Use the obtained degrees array to calculate grating/stimuli luminance level
For example, to render a sinusoidal grating of frequency 0.1 cpd on a monitor that is 1920px wide I do:
scrWidthPx = 1920; % px
screenReso = 40; % px/cm
viewD = 7; % cm
freq = 0.1; % cpd
degs = px2deg(scrWidthPx, screenReso, viewD);
y = cos(2*pi*degs*freq);
The array y now contains 1920 luminance levels which, when rendered horizontally across the 1920 screen pixels, would simulate a grating of 0.1 cpd at the specified viewing distance. The plots below demonstrate how this is perceived by the observer.
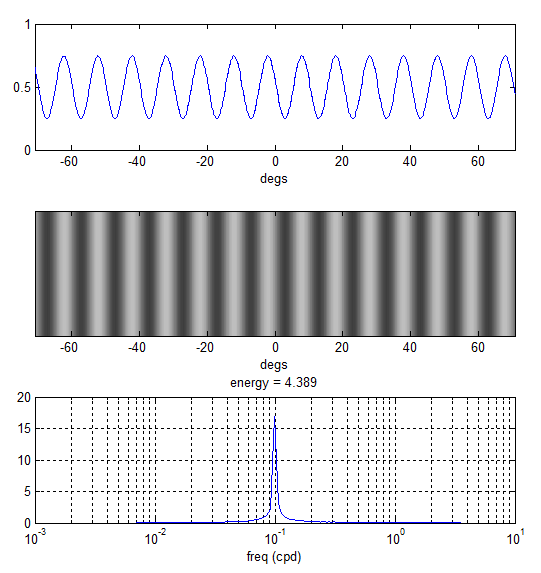
The rendered stimulus is now narrow-band as intended.
Precautions
The correction above assumes a certain viewing distance and that the observer is positioned laterally in front of the screen centre. If the observer position changes then the perceived stimulus will have a different spectrum and so it is important to ensure that subjects (in our experiments, mantids) are placed at the correct viewing distance both away from the screen and laterally to minimize any errors.
How does this affect our CSF Data
The “warping effect” that we described above must be taken into consideration when interpreting the data we published in the mantis CSF paper. Each spatial frequency we rendered was actually perceived by the mantis as a broadband signal and so the actual mantis CSF is likely more narrow-band compared to what we reported.
10th May 2017
Just to follow up on this post by Ghaith. After we realised this issue, we did some experiments to figure out what part of the visual field drives the mantis optomotor response. We concluded “The optomotor response of the praying mantis is driven predominantly by the central visual field”. As we showed in that paper, stimuli directly in front of the mantis contribute most to driving the optomotor response, with a roughly linear decline to each side. Stimuli beyond 70deg eccentricity have little or no effect, and the bulk of the response will be driven by what’s happening between +/-40 deg. Thus, the dramatic increase in frequency towards the edges of the screen is probably less important than we initially thought it might be.
Hello, I am trying to calculate the optomotor response and visual acuity in mice. I have built a machine to do this and I am trying to make my sine-wave gratings now at various spatial frequencies. The images will need to be printed rather than being viewed on a screen, so I’m wondering if your conversion equation for cpd to cycles/pixel would be transferable in some way. We are trying to use MATLAB to create these. Thank you!
Hi Shelby, I think it would be exactly transferable, yes. You’d just need the appropriate resolution for your printed image (usually expressed as dots per inch rather than pixels per centimeter, but the idea’s the same). If your printed gratings are going to be pasted onto a cylinder which is rotated around the animal, you won’t have to worry about the changing spatial frequency across the plane.
Hope that helps,
Jenny