Zoltan’s diary: Friday 22/02/2013

The moral of this day was to realise that how hard it is to obtain reliable data. The worst thing you could do is to have a minimal amount of data, and make conclusions going too far from them.

Valuable lesson. I will harass more people to have enough pilot data. I think I will have to re-design the test, as there are some interesting regions that need more attention.

Zoltan’s diary: Thursday 21/02/2013

Spent some (most of today’s) time with Matlab. Basically, number crunching, plotting, added some functionality to the tests, and tested myself properly. Found an anomaly in the parameter randomisation method, which will give me a headache later on. They are randomised, but I need to make sure that I have precise control of the ratio of the parameters used. Because right now, as far as the parameter generation algorithm is concerned, I could have 200 tests of the same type and none of the one that I would be interested in.

Why do I need to test for something I don’t really need? I need a reference. My front paw (a.k.a hand) is not a precise instrument. I may slip the mouse, not manipulate keys properly, make typos basically all the time. It’s really like military technology: we don’t care how good/bad it is as long as we precisely know how good/bad it is. (for those who don’t speak English as a main language – like myself there is a difference in the qualitative and quantitative use of the word ‘how’)

The results were a lot less vague than yesterday. Also, a lot more consistent, which is a plus. In addition to that, I need to do very little manual work on the results, so the process is largely automated.

However, my visual pathway still doesn’t know how to do integration, and is being consistently fooled at the same luminance levels. I wonder if that is the case with others.

Well, time to call in a few favours, let them stare at the glass through two periscopes for some time (as well)!

Zoltan’s diary: Tuesday 19/02/2013

Yesterday, I managed to linearise my CRT monitor. I was not impressed by it, things looked awkward and the gamma value was way off the normal range. When I wrote my post yesterday, I went home thinking about an ageing triode: as I said before, the characteristics shift towards lower currents (luminance!), with some pretty bad non-linear distortion. So I plotted my measured gamma values against the driving signal. Bingo. Gamma was around 4 on 6% brightness and 2.5 at 96%. Whoa.

So I had to change the bias on the valve (monitor: increase brightness to around 80% from the factory-set 50), until I could perceive a 1% patch with respect to the black background. Yes, and I re-did all 300 of my measurements as well… this time it worked as expected: gamma varies from 2.3 to 2.8. A bit too hefty on the red, but I don’t need to worry about that, as I am now interested in luminance only.

Yes, I managed to linearise the monitor with both settings. However, there are moments when ‘things work, but they don’t feel right’, and this was one like that.

I assembled my experiment setup, and tested myself to obtain preliminary data. Well, I’m not blind :). But my vision surely doesn’t know how to solve an integral!

Zoltan’s diary: Monday 18/02/2013

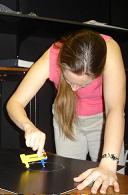
Today I implemented the data format, and calibrated the monitor (that is, three hundred individual measurements, by hand, the old-school way). Been away to see adapting boundary techniques as well.

The monitor is today’s wierd one: Normally, the triode gamma value should be around 2.5 for a CRT (1.1 for an LCD). This old fellow does 2.94. And not just that, it barely does 70% of its original spec in brightness.

If I remember right, the cathode ‘vanishes’ with age, and therefore the distance between the grid and cathode increases. This means that gradient (transconductance) of the valve decreases, so the nice x^2-like graph gets distorted. It took me 6 hours to make the measurement properly. Needed to be in complete and utter darkness, and had to read the photometer by hand.

It was fun, even made a notice on the lab door ๐Ÿ™‚

The adaptive boundary setting will have to depend on the luminance level. Tomorrow, I will be able to get more data, and can see the emerging pattern. Need to plot dy/y.

Zoltan’s diary: Thursday 14/02/2013

The computer booted up today without any major hassle. I had display. I am impressed!

Finished the first version of tests. What caused the flicker wasn’t by Windows, it was Matlab writing to the console. By suppressing the messages, I managed to provide the appropriate stimulus (Thanks Jenny!).

The code works, it may be worthwhile cleaning up, as now they operate as functions that access pre-defined and pre-set global variables. For some reason, this is a major no-no in matlab. Probably because they don’t have nice mutexes implemented for variables, and because functions are there to make software workspace-independent (which I intend to do, but needs more integration!).

Both tests appear to be working now, interestingly I got some weird results. Of course the dispay is not calibrated yet, so anything could happen, the wackiest result is just as inaccurate as the most sensible one.

I couldn’t do much with the photometer (still couldn’t get oscilloscope probes), I have two options:

1., Do the calibration by hand, which is a lengthy, painful procedure.
2., Try to borrow (beg! :)) an other one, from an other lab, and try making a software to automate the calibration.

Buying an other one is not an option, as the cost is about 3000 pounds for a device that was designed in 1987.

Anyway, when calibration has finished I just need to surround the brightness/contrast/gain control buttons of the monitor with an electric fence and not to update the driver.

Zoltan’s diary: 12/02/2013

This day started as a problematic one: almost the whole day passed when I finally got my admin account for the computer. And that’s when the steamroller started!

When I am in a project, I make sub-units in order to achieve goals and measure progress. I think I have two out of three done. The three sub-units are the following:

1., Eyesight alignment and relaxing stimulus (95% done)

2., Brightness control for the patch (70% done)

3., Frame alternator

The fist one is practically ready. I am using a randomly organised, static binary starfield, which will give a reasonable overall brightness, and won’t set off the monitor to full blast, which is very unpleasant in a completely dark room.

The second one I struggled with: It seems that Windows and libusb doesn’t really mix: I managed to crash the entire OS (yes, not just matlab itself!) many times. And every crash caused a good 10 minutes downtime to allow booting. So, I re-mapped shade control to the following:

Absolute mouse Y coordinate (with respect to the screen resolution)
Sublte control is done with the left and right mouse keys. Quitting is done by pressing the scroll wheel.

Originally, scroll wheel + derivated mouse Y coordinated would have been the solution.

I am concerned about the performace: Will I have enough ‘horsepower’ to render four patches at 140 frames per second? I will have to check UI at every 4-5 frames only, so I can have some relief there.

Also, by declaring and setting variables before loops, I could save more computational time. We will see.

I have fiddled with the photometer as well: it doesn’t appear to behave how the protocol is described: it regulary sends garbage, which is randomly mixed with data. Not good. Will take a look at the outgoing signal with an oscilloscope. Last time I had this problem with and old kit was due to inadequate smoothing on the power rail. Also the poor thing wasn’t calibrated in two years!