


Hotspotting or brightness inhomogeneity
Ideally, a rear-projection screen would be a perfect diffuser, transmitting light equally in all directions independent of the angle of incidence. In practice, this is not attainable, especially when I also require that the polarisation of the light should not be changed by passing through the screen. Thus, in reality the light is not perfectly scattered, and so more light comes through along the direction of the incident beam. This means that there is a visible bright “hotspot” near the middle of the screen, where you can effectively see the projector lens through the screen. This hotspotting is actually not too much of a problem, as for many stimuli I want the contrast or luminance to fall off as a Gaussian function of distance from the centre of the screen anyway. A related problem is that the two projectors will not give exactly the same luminance at any point on the screen, both because of overall differences in brightness, and because their hotspots are in slightly different locations. Potentially, differences in luminance between the eyes could introduce nasty artefacts, e.g. causing the Pulfrich effect.
I aim to correct for both of these effects in software. Before I can do this, I need detailed measurements of how brightness varies across the screen and between projectors.
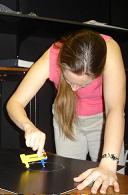
Emilia Iwanczuk took a detailed set of measurements of the luminance on the screen, shown below. She did this in two ways.
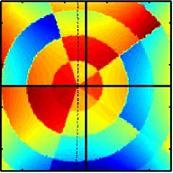
- Photometer (left-hand figure below). In the set of measurements shown on the left (top row), she measured the luminance recorded by the photometer when the projector was displaying a white field (displayed pixelvalue 255 across the whole screen). Each square shows the mean of 3 measurements, but the SD was pretty large — typically 10% or so. This is much larger than when measurements were taken via computer, and stems from the fact that these measurements were taken by hand, pointing the photometer at the centre of each square in turn, whereas the gamma correction values were taken by computer with the photometer fixed on a tripod. I assume that the large error explains odd features like one dimmer square in between two brighter ones. The photometer was pointed at the screen through the polarising filter, which both helped to keep the photometer in roughly the same position, and also took account of any change in luminance caused by differential polarisation at different angles. The grayscale shows luminance in cd/m2. This makes it clear how severe the inhomogeneity is. For the top projector, the luminance varies from 651 cd/m2 in the middle to 61 at the corners. For the bottom, it varies from 468 cd/m2 in the middle to just 1.2 cd/m2 at the corners.
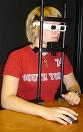
- Psychophysics (right-hand figure below) Emilia also measured the inhomogeneity as perceived by her own visual system. The stimulus consisted of two gray spots on a black background. The central spot was displayed on the bottom projector, and its luminance was fixed. The peripheral spot could be displayed on either projector, and its initial luminance was random. Emilia adjusted the brightness of the peripheral spot, using the mouse, until it appeared to be the same as the central spot. Her head was fixed in a head and chinrest, but she was free to move her eyes back and forwards between the dots as she made the measurements. In order to account for any change in brightness caused by polarisation, she wore the stereo glasses during these measurements. This made the task uncomfortable, because each spot was only visible in one eye. It was also difficult to judge brightness, given that there is a slight mismatch in color between the two projectors; in one of them, gray appears greenish whereas in the other it appears reddish. The grayscale shows the difference between the pixelvalue of the peripheral spot and that of the central spot at the point of subjective equality (PSE), subtracted from 205 (the maximum value of the difference, since the central spot always had a pixel value of 150). I plotted it like this to make it easily comparable with the photometer measurements. In the centre, the peripheral spot appears the same brightness as the central spot when it has the same pixevalue; this is represented by the white values close to 205. Around the edge, the peripheral spot needs to be given far higher pixel values to appear the same brightness: often even a pixel value of 255 is not enough, which is why the plot is bounded by 0 around the edge (205-(255-150)=0). This limit means that these psychophysical measurements likely underestimate the true extent of the hotspot.


The middle row shows the result of a fit. For the photometry data (left plot) I fitted the sum of 3 Gaussians (allowing centre, amplitude and horizontal/vertical SD of each Gaussian to vary — so 15 parameters in all). For the psychophysics data, I just fitted a single Gaussian (5 parameters). The bottom row shows the values predicted by the fit for the full 1280×1024 pixels, rather than just the 8×8 grid Emilia took the measurements with.
I then used this fitted data to see if I could cancel out the hotspot, and obtain uniform luminance, by projecting an image with a dark centre and bright corners. In practice what I did was to apply a transparency mask in Psychophysics Toolbox, using this to dim the centre of the image while allowed the corners to shine through.
The plots below show the results Emilia measured with the photometer for this notionally uniform luminance field. I am a bit disappointed that the measured brightness still varies by a factor of >2, from 23cd/m^2 to 65cd/m^2 in the bottom projector and from 21cd/m^2 to 41cd/m^2 in the top one. However, this at least partly reflects the large amount of noise in the measurement. Emilia took 3 measurements at each point; the average scatter (max-min) was about 10cd/m^2. At least the variance in luminance now looks like noise: there doesn’t seem to be a tendency for it to be either brighter in the centre (reflecting an uncorrected hotspot) or dimmer there (reflecting over-correction). I am also disappointed that one of the projectors is so much brighter than the other. This was meant to have been corrected for. I think the problem is that the measurement is very sensitive to where the photometer is positioned, and where it is pointing. These measurements were taken with the photometer held manually, and so they are rather unreliable.

Emilia also took another run of psychophysics data using this correction. Again, here the stimulus was two dots as before; now the central dot had a pixelvalue fixed at 150. However, the stimulus was viewed through a transparency mask chosen to correct for the brightness inhomogeneity. Thus, the two dots might have the same pixel value of 150 before the mask was applied, but the central dot appeared only dimly through quite an opaque mask whereas the peripheral one was allowed to shine through, so that the values actually sent to the projector could be 30 for the central one and 145 for the peripheral one. If everything has worked correctly, the hotspotting will then ensure that the two dots have the same luminance!
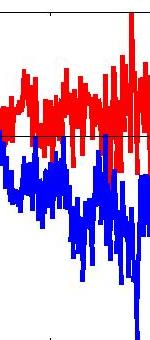
The figure below shows the results from this task (mean of 3 adjustments at each position). Values of 0 mean that dots with the same pixelvalue (before the transparency mask was applied) appear with the same luminance; thus ideally this would be 0 everywhere. In fact, it does look as if this is roughly true, although there is a lot of noise. So, it seems that this hotspot-correction has been reasonably successful. The brightness maps which were used for this correction are stored in FittedBrightness210606.mat.
