


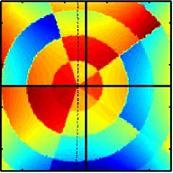


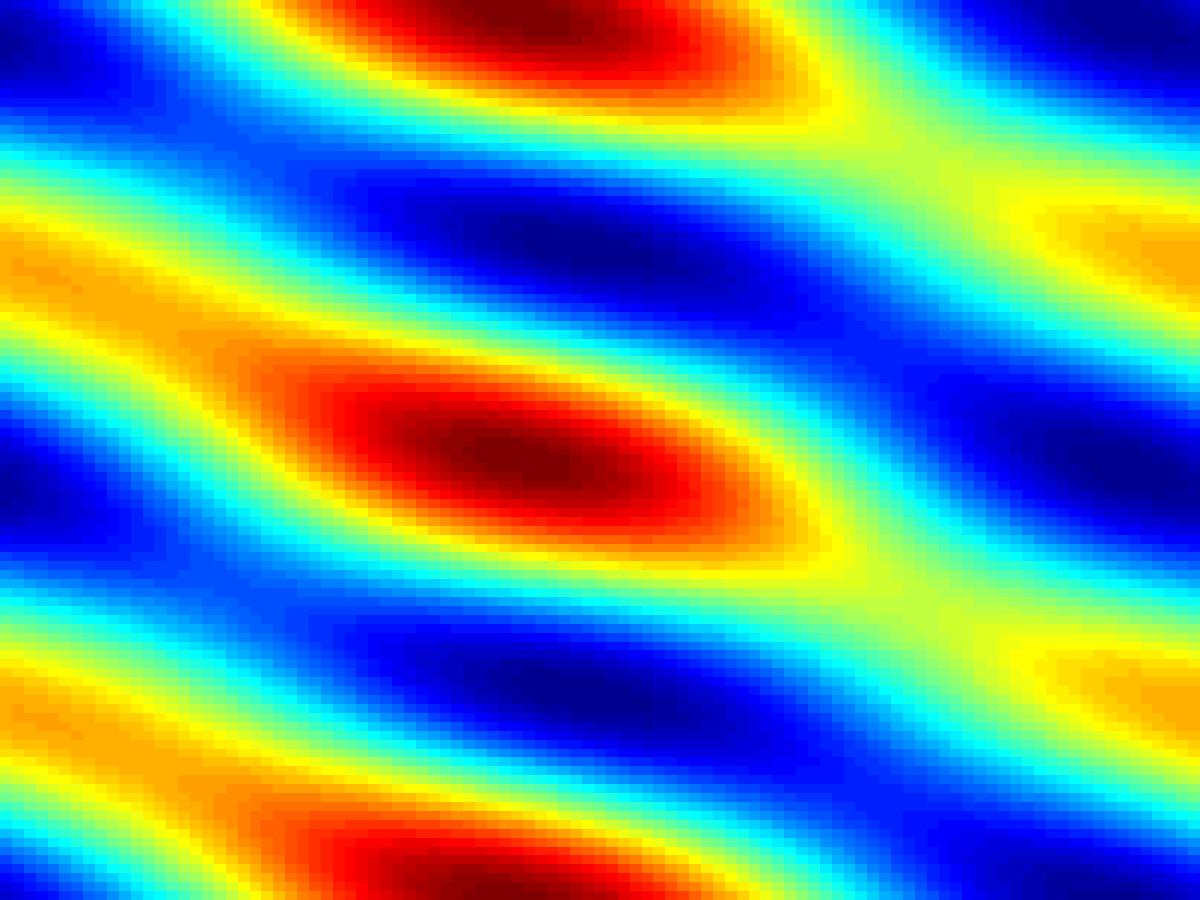
Curtain Plot 2 – represents the population activity in energy-model neurons with both position- and phase-disparity. Position-disparity is along the horizontal axis and phase-disparity along the vertical.
Such images were dubbed “curtain plots” by my colleague Christine Bredfeldt, on the grounds that with a different colourmap they reminded her of a set of 1970s curtains.