Click here for some background on gamma correction. I have considered various ways of gamma correcting. See here for technical details on taking photometric measurements with my system.
Using the graphics card
First, the control panel for my NVidia graphics card has a slider enabling me to change its value of gamma. NB There was a subtlety in setting gamma on the graphics card. When I initially set it in span mode, I found it was applied only to one projector. Graeme figured out how to get round this: you need to go into single-display mode, set the gamma on both projectors separately, and then return to span mode.
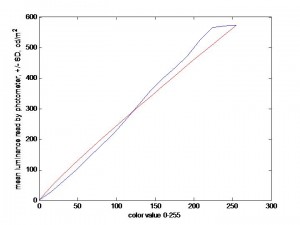
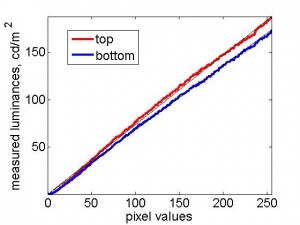
I first tried simply adjusting the graphics-card gamma to get a linear luminance/pixval function. However, there were no suitable values. The blue curve below shows the luminance/pixval curve after I’d set the NVidia gamma to 2.09. The red curve shows the best-fitting gamma-function, which had gamma = 0.92. This was as close to linear as I could get, but obviously it’s terrible.
Using the projector controls
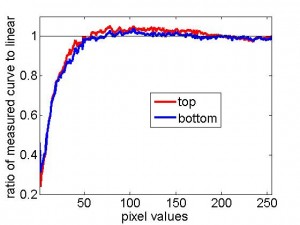
However, the projectors also have a “gamma” control. This can take values ranging from 0 to 15 (default 8), so it obviously doesn’t quite mean gamma as defined above, but it seems to have roughly the same sort of effect. However, its effect depends very strongly on the brightness and contrast settings of the projector. I wasn’t able to find settings of brightness, contrast and projector-gamma that gave me a linear luminance/pixval function, but I was able to get the projector into a state where it could be corrected with the graphics-card gamma.
To do this, I first looked for settings of brightness/contrast/gamma on the projector that produced a luminance/pixval function which was well described by a gamma (power-law) function. I then set the value of the NVidia-gamma so as to cancel out this gamma and produce a linear curve. The best values I found were: projector contrast = 5 (default=32), brightness = 15 (default=32), gamma = 15 (default=8), and graphics-card gamma = 1.78. This isn’t perfect either, but obviously it’s a big improvement:
NB You’ll notice that there is a lot of “wobble” in the curves. This is real and reproducible. If I take 10 measurements with the photometer (randomly interleaved with other measurements, but all performed remotely with the photometer fixed on a tripod), the SD in the measurements is very small, considerably smaller than the “wobble” in the curve. In other words, the wobble is not due to noise in the measurement, or in the amount of light produced by the projectors for a given pixel value. Each pixel value elicits the same amount of light every time, but the amount of light produced is not a smooth function of pixel value.
Using a look-up table in PTB
I then looked at doing the gamma correction in PTB.
In PTB, you read the current gamma-table using a statement like
CLUT = Screen(‘ReadNormalizedGammaTable’, window);
where “window” is a pointer to a PTB window opened earlier. You change the CLUT using
Screen(‘LoadNormalizedGammaTable’, window, gamma_CLUT);
where “gamma_CLUT” is a 256×3 matrix whose entries are in the range [0,1].
To make the response linear, I first measured what each “strength” corresponds to in pixels. In Matlab PTB, I wrote:
origclut = repmat([0:255]’/255,1,3);
Screen(‘LoadNormalizedGammaTable’, window, startingclut );
Unfortunately, I found that the two projectors had slightly different luminance/pixel-value functions, as shown in the following figure:
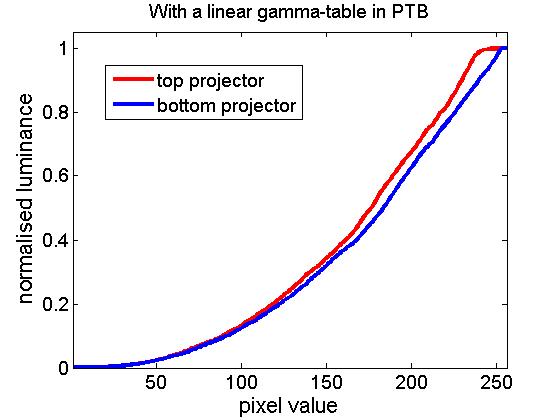
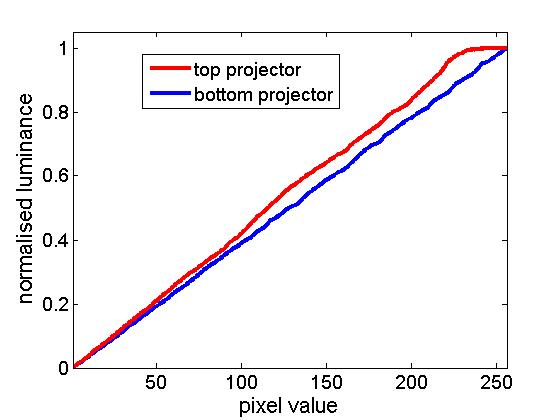
Notice that the top projector (red curve) in particular saturates horribly: all pixel values above 244 give approximately the same luminance. The bottom projector saturates a little too. Because of the differences between the projectors, and because PTB can only use a single look-up table, I can only linearise one projector at a time in PTB. The following figure show results obtained when I set the PTB gamma look-up table to the inverse of the curve previously obtained for the bottom projector. This has worked fairly well to linearise the bottom projector (blue curve), as it should. The top projector (red curve) is not linear; it still saturates horribly.
Using my own software
So, I decided that I could not do the full correction in PTB. I would have to write my own software to do it. I tried (i) leaving the projectors on their default settings for convenience; (ii) changing the NVidia gamma to 1 on both projectors; (iii) setting the PTB gamma-table so as to linearise the bottom projector; (iv) then applying a correction in software for both projectors. This software correction is obviously negligible for the bottom projector, but it linearises the top projector. It also takes account of the fact that the top projector has effectively only 244 gray levels, and it can cope with the hotspotting.
The results are shown here.
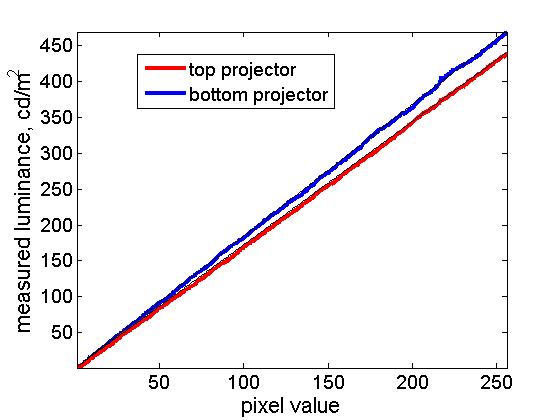
You may be able to see a thin black line drawn over the coloured lines — this is a linear function, for comparison. You can see it’s not too bad.
However, for a large image (mine are 2560×1024), interpolating to find the correct luminance is very slow. I could probably speed it up by writing better code, but I still think it would be quite punishing to do this every frame. I therefore looked at returning to the “best” settings I found for the projectors.
Using the projector settings, graphics card and PTB look-up table
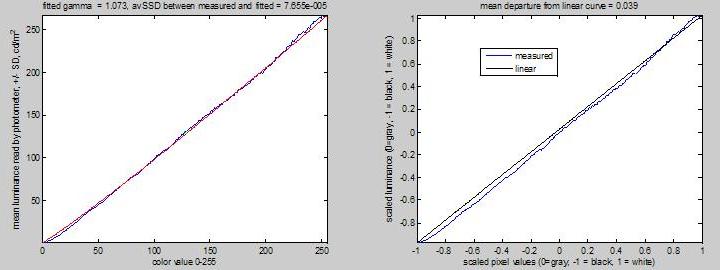
For some reason, when the projectors are set to contrast=5, brightness=0, gamma=15, they behave much more similarly than with their default values. The curves below show the measured luminance for both projectors, rescaled so that 0 is the minimum luminance measured for each projector and 1 the maximum. On the right, I’ve plotted the curve for each projector divided by the straight line from 0 to 1 (so ideally, this ratio would always be 1).
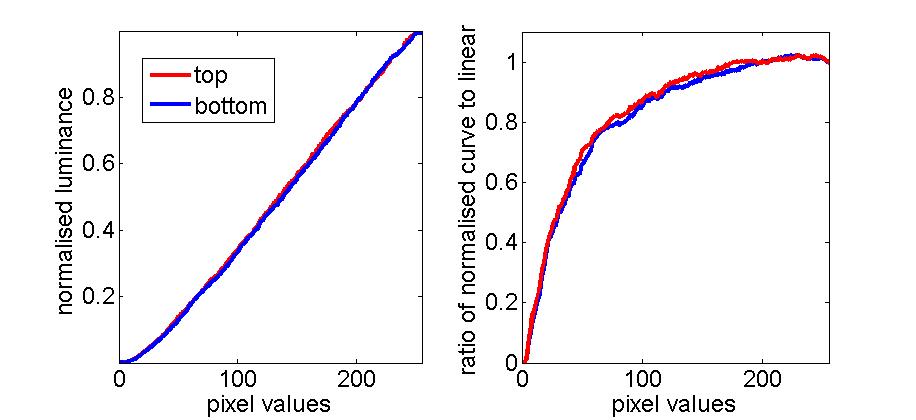
Because the projectors both deviate from linearity in approximately the same way, I can use a single look-up table in PTB to linearise both projectors, at least approximately. When I tried doing this, I came across a curious phenomenon. I had believed that in order to calculate the optimal look-up table for each projector, I should measure its luminance/pixel-value curve obtained with a linear look-up table in PTB (ie a look-up table which rises linearly from 0 to 1), and then take the inverse of this function using interpolation. However, this did not quite work. The following figure shows the look-up tables calculated on this basis to be optimally linearising for each projector. In the right-hand panel, I’ve plotted the ratio of these two functions, to highlight the small differences.
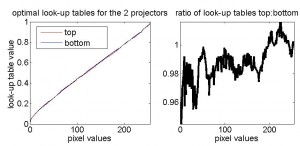 Because the two look-up tables were so similar, I then took the average of the two and used it as the look-up table in Psychophysics Toolbox. I then measured the luminance function for each projector separately, shown below. In the right-hand figure, I have plotted the actual curve divided by a straight line rising from minimum to maximum for both projectors, which makes it easier to see the deviation from linearity. Once again, the black lines represent the ideal, linear curve. (NB The projectors are set to contrast=5, brightness=0, gamma=15. The NVidia graphics card is set to gamma=1.78 on both projectors.)
Small “wobbles” away from linearity
However, as you’ll notice, there is still quite significant departure from linearity. At first I thought this was just due to three obvious sources of error:
- Noise in the luminance (either in the measurement, or the luminance produced by the projector for a given situation).
- The fact that the gamma table has to be monotonic on Windows, and so cannot take complete account of the “wobbles” in the measured luminance/pixelvalue curve.
- The fact that the gamma table was not optimal for either projector, but was the average for both of them.
- The fact that the values passed to the graphics hardware are inevitably quantised into 255 levels.
However, on closer inspection I did not believe these sources of error could account for the discrepancy. The measurements are very repeatable: ie the projectors produce reliably the same amount of light each time I ask them to display a given stimulus with a given gamma table, and the photometer records the same measurement each time. The scatter on interleaved repeated measurements cannot explain the departure from linearity in the above figure. Looking at the lowest pixel values, it’s clear that both projectors are producing too little light. If the discrepancy was caused by the averaging of the gamma tables, then one projector would produce too much light and the other too little. Also, it’s clear that I could get closer to the desired, linear curve (black line) by choosing different pixel values; i.e. the quantisation is not to blame.
Iterative procedure
I’m not sure whether this failure represents my failure to understand gammatables, or some peculiarity of PTB and/or my projectors. However, empirically I’ve obtained much better linearisation by a more time-consuming set of measurements. I started out with a linear gammatable, and then, starting from the last-but-one row (the 255th), tried a variety of different values until I found the one which gave the luminance closest to the desired value. I then uploaded the new gammatable and experimented with the 254th row, and so on. This iterative technique produced much better linearisation: now I do appear to be limited by the three constraints mentioned above. The Matlab code for this is here. Here are the results of testing this gammatable:
The left-hand panel shows the actual luminances (straight lines superimposed in black). The middle panel shows the ratio of the curves obtained to the ideal linear value. For most of the range, the curves are within a few percent of the desired value. The right-hand panel shows the difference between the curves obtained (rescaled so the maximum luminance is 1 and the minimum is 0), and the straight line going from 0 to 1. This shows that the error in the luminance is almost always less than 1% of the maximum value. Notice that because these curves were obtained using the average of the two gamma look-up tables obtained for the two projectors, the errors are in opposite directions for the two projectors. These data were taken with the projectors set to contrast=5, brightness=0, gamma=15; NVidia gamma = 1.78. The gammatable used in Psychophysics Toolbox is given here.
Gamma correction on a CRT
For comparison, I also tried linearising the luminance on a CRT. The left-hand panel shows the luminance-pixel value function obtained with a linear PTB gammatable. The middle panel shows the PTB gammatable which I deduced would be necessary to linearise the display, i.e. the inverse of the previous curve. The right-hand panel shows the luminance-pixel value function obtained with this PTB gammatable. It does, as expected, linearise the luminance. (NB all luminances have been rescaled to go from 0 to 1.) I believe that the regions where the measured curves goes above linear in panel C are places where the PTB gammatable is too high, because it is constrained to be monotonic, and so cannot take account of the little dips in the curve measured in panel A. Apart from that, the linearisation seems completely successful. I am surprised to see that the luminances recorded from the CRT also have a lot of “wobble”. I thought this was a limitation of my LCD projectors, but perhaps not. Admittedly these data, unlike the data shown above for the LCD projectors, were taken with the lab lights on, so it is theoretically possible that slow fluctuations in the ambient lighting were responsible. I have not taken the time, as I did for the LCDs, to check that these “wiggles” are reproducible and consistent across repeated measurements. I am unable to compare these results with those of other people for CRT monitors, since in the limited number of other people’s data I have seen, they have not measured the luminance at every pixel-value as I have, and so the small wiggles would not be visible in any case.
31st October 2006 – Multiple monitors and colours
I returned to this issue after upgrading Psychophysics Toolbox to version 3.0.8 (beta), which has support for multiple monitors. For the results reported here, I was using my NVidia graphics card in “dual view” mode. I opened a separate PTB window for each projector. The top projector was screen 3 and the bottom is screen 1. I did not use stereomode=4 (as above); I used stereomode=0, and drew images on the appropriate window. One advantage of this new system is that I can set the PTB gamma table independently for the two windows. So, I used the tables I had stored on July 4th, and retested the system. For speed, I only used a few pixel values (which is why you can’t see wiggles in the plots below), because I also wanted to measure the extinction ratio for the different colours of the projectors, so the figure below contains data from 16 curves.
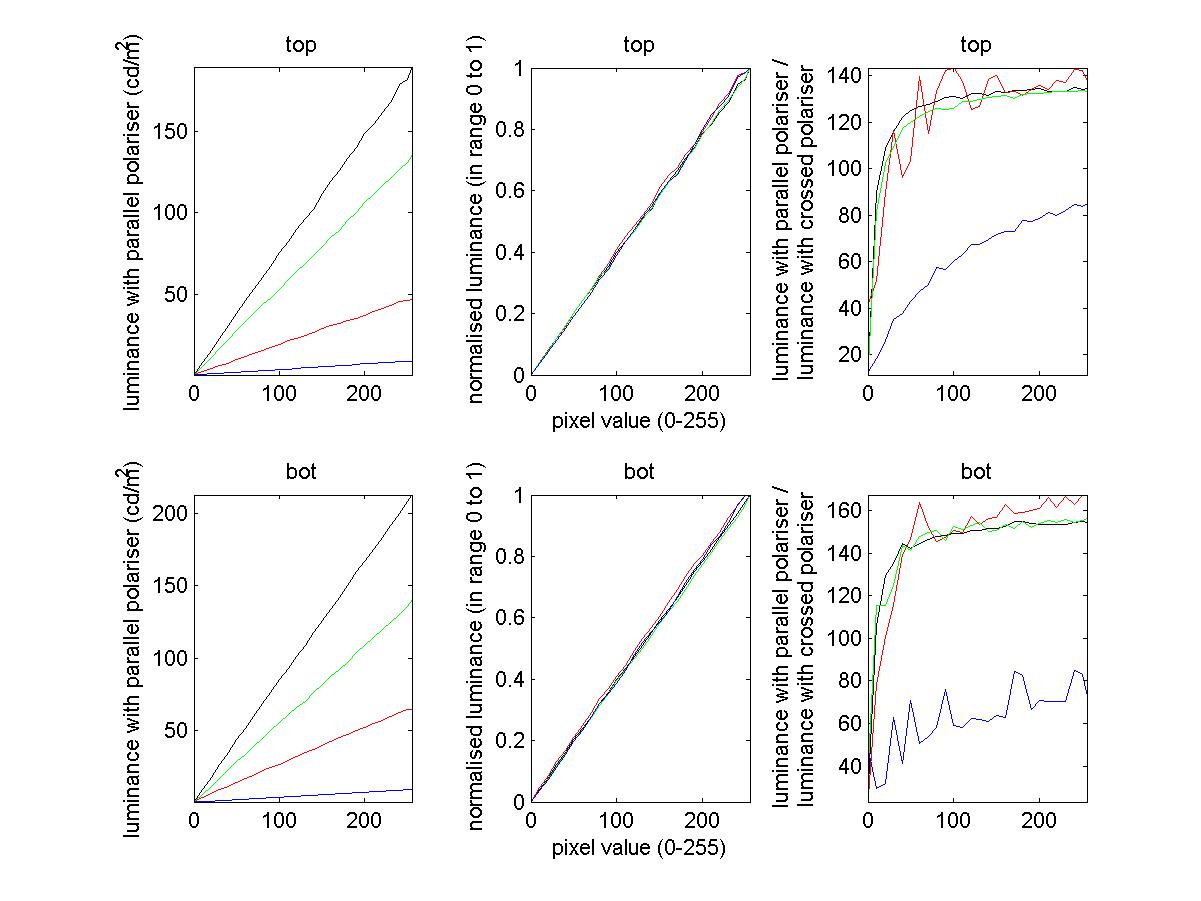
The left-hand panels show the measured luminance as a function of pixel value X. Clearly it is very close to linear, i.e. the gamma correction has worked well. Since a few months have now elapsed since I obtained those look-up tables, this also suggests the gamma correction remains stable over time. In the middle panels, I have replotted this measured luminance after normalising it to the range 0 to 1. This makes it easier to see that the linearity is excellent for all three colours individually.
Finally, on the right, I have plotted the extinction ratio for all three colours individually, as well as for grayscale. This is the luminance measured when the two polarising filters (the one in front of the projector and the one in front of the photometer) were parallel, divided by the luminance measured for the same pixel-value when the two polarising filters were orthogonal. The values are similar for red, green and white (grayscale). Blue has a much worse extinction ratio, but I am not too worried about this since the measured luminances were so small. NB these measurements were taken with a photometer, not a chromometer. The blue square did not look noticeably dimmer than the red or green square to human eyes, although I have not quantified it.


